Network discovery
rules allow you to tailor the information discovered for your network
map to include only the specific data you want. Rules in your network
discovery policy are evaluated sequentially. You can create rules with
overlapping monitoring criteria, but doing so may affect your system
performance.
When you exclude a host or a network from monitoring, the host or network does not appear in the network map and no events are reported for it. Cisco recommends that you exclude load balancers (or specific ports on load balancers) and NAT devices from monitoring. These devices may create excessive and misleading events, filling the database and overloading the Firepower Management Center. For example, a monitored NAT device might exhibit multiple updates of its operating system in a short period of time. If you know the IP addresses of your load balancers and NAT devices, you can exclude them from monitoring.
In addition, if you need to create a custom server fingerprint, you should temporarily exclude from monitoring the IP address that you are using to communicate with the host you are fingerprinting. Otherwise, the network map and discovery event views will be cluttered with inaccurate information about the host represented by that IP address. After you create the fingerprint, you can configure your policy to monitor that IP address again.
Cisco also recommends that you NOT monitor the same network segment with NetFlow exporters and Firepower System managed devices. Although ideally you should configure your network discovery policy with non-overlapping rules, the system does drop duplicate connection logs generated by managed devices. However, you CANNOT drop duplicate connection logs for connections detected by both a managed device and a NetFlow exporter.

Click edit (pencil icon) on the configured ACP created earlier (LAB_POLICY).
There currently no Rules created and the Default Action (bottom) is set to Network Discovery Only. Click Logging (scroll icon).

Tick Log at End of Connection. The Event Viewer under Send Connection Events to will be automatically selected. Click OK.

Click Save > Deploy.

Tick on the target device > Deploy.

I streamed some videos in Youtube.com and CCN.com in order to generate data in the FMC Summary Dashboard. This is performing a Passive Network Discovery since we're sniffing for network traffic and send to the FirePOWER module.
To view the Networks covered by the Network Discovery policy, go to Policies > Network Discovery > Networks. Notice all networks are being matched by default.

Click edit (pencil icon) on the right. Notice all Networks are configured for Network Discovery. It's good practice to narrow down the network scope in order to minimize the collected data and send to the FMC database (avoiding public Internet addresses, Bogons, etc.).


Type the Name > Network: 192.168.1.0/24 (in CIDR notation) > Save.

Configure the same for the wifi network.

Go back and edit the default Network Discovery Policy under Policies > Network Discovery > edit (pencil icon).

Delete the all zero network (0.0.0.0/0 for IPv4 and ::/0 for IPv6) by clicking on the trash icon.

Click on the Network Object created earlier > click Add to move it to the right.
Under Action: Discovery tick Hosts > Save.

Leave the default under the Zones and Port Exclusions tabs.


Click Deploy (beside the green check mark).

Tick the target device > Deploy.

Click on Custom Operating Systems (above Out of date on 1 targeted devices) > Create Custom Fingerprint.

You can create Custom OS Fingerprint.

Click on Custom Topology.

Click Create Topology. This would provide the FMC (and admin) of the IP address scheme of your network.

You can dynamically add a network by typing a Name > click Import Policy Networks > Load.


Click Save.

Click on the slide button (make it blue check) to enable.

Go back again to Network Discovery policy under Policies > Network Discovery.

Leave the default under the Users tab.

Go to Advanced > General Settings.

Tick Capture Banners > Save. This is to capture server OS Banners. Leave the other options in default.

Click Deploy.

Tick the target device > Deploy.

To view network traffic, go to Overview > Dashboards. This will automatically go to the Firepower Summary Dashboard.


The gathered data for Network Discovery is available under Analysis > Hosts.

Under Network Map you'll find the discovered IP addresses based on the Network Discovery scope. Click on the plus (+) symbol to expand the scope. I turned off other VM in my lab since the FMCv eats a lot of memory.

Click on a specific IP address to view more details on the Host Profile page. The 192.168.1.2 is the Cisco ASA FirePOWER module.

The 192.168.1.100 is my Windows 10 VM host.
The 192.168.1.200 is the Cisco FMCv. Click on Connection Events under the View option.

A new page will open and displays the filtered Connect Events using 192.168.1.200 as the Initiator IP.

You can manually define the host OS by clicking on the Edit Operating System.

A drop-down option will appear for the OS Definition. The 192.168.168.1.100 is using Windows 10 64-bit OS.

Select the correct OS Definition > click Finish.


You'll find the Applications and Protocols that are running on the specific host.

The Vulnerabilities will also be listed for the host OS.

Click on the topology hyperlink (on the right of Host [IPv4]. The 192.168.1 hosts are grouped under the LAB-WIRED - 192.168.1.0/24.

Go to Analysis > Hosts > Hosts to view a summary of the host OS information that were gathered.


Go to Analysis > Hosts > Indication of Compromise to view any compromised or infected host.


Go to Anyalysis > Hosts > Applications to view the detected Applications and hit Count running in the network.


Go to Analysis > Hosts > Application Details to view more details on a particular Application and hit Count.


Go to Analysis > Hosts > Servers to view Hosts running Server Applications and hit Count.


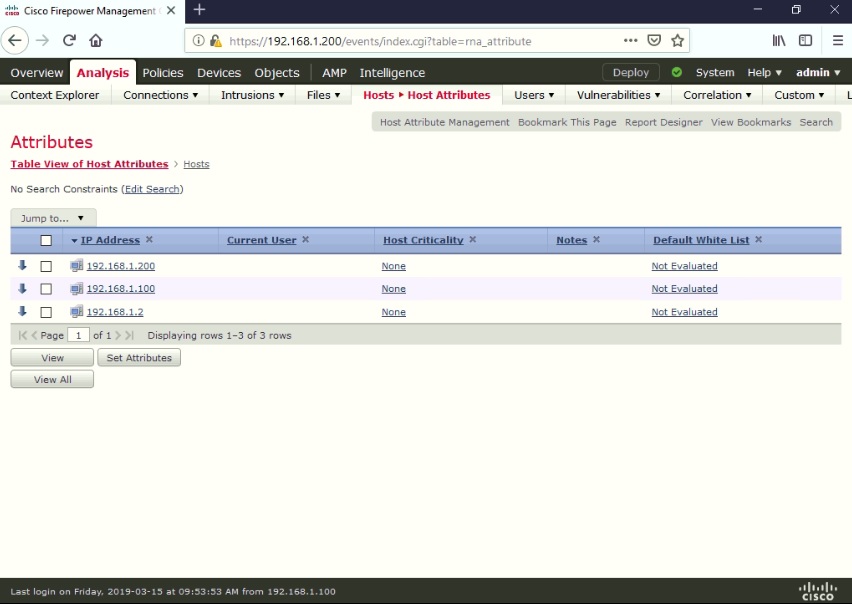
Go to Analysis > Hosts > Host Attributes.


Go to Analysis > Hosts > Discovery Events to view Host and Application discovery events.


Click Add Nmap Instance.

Type the Instance Name > type the IP for Black Listed Scan hosts. I've typed the FMC IP 192.168.1.200 to bypass the Nmap scan. Click Create.

Under Configured Remediation > select Nmap scan (the only option available) > click Add.

Type the Remediation Name > select the Scan Which Address(es) from Event (I chose Scan Destination Address Only).
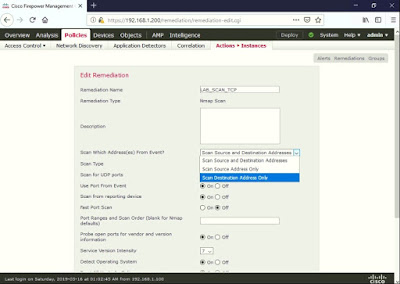
Choose the Scan Type (I chose the default TCP Connect Scan).


After the Nmap Scan Instance has been created, click Scan Now (green arrow button on the far right).


The Nmap Scan will finish in a few minutes (depending on the Scan type and Port range defined). My Nmap Scan Instance was finished in 2 minutes.

To view the Nmap scan result, go to Analysis > Hosts > Discovery Events.

Look under Event: Add Scan Result and Description: Scanner Nmap. Click on the PC icon (Open Host View) with the scanned IP address (192.168.1.100).

The Nmap scan was able to discover more ports or services (count of 7) versus the previous count of one (1) under Servers.

Further below is the Nmap Scan Results.

You can also perform a scheduled Nmap scan under System > Scheduling.

Click Add Task.

Under Job Type: select Nmap Scan.

Fill up the needed info and click Save.

When you exclude a host or a network from monitoring, the host or network does not appear in the network map and no events are reported for it. Cisco recommends that you exclude load balancers (or specific ports on load balancers) and NAT devices from monitoring. These devices may create excessive and misleading events, filling the database and overloading the Firepower Management Center. For example, a monitored NAT device might exhibit multiple updates of its operating system in a short period of time. If you know the IP addresses of your load balancers and NAT devices, you can exclude them from monitoring.
In addition, if you need to create a custom server fingerprint, you should temporarily exclude from monitoring the IP address that you are using to communicate with the host you are fingerprinting. Otherwise, the network map and discovery event views will be cluttered with inaccurate information about the host represented by that IP address. After you create the fingerprint, you can configure your policy to monitor that IP address again.
Cisco also recommends that you NOT monitor the same network segment with NetFlow exporters and Firepower System managed devices. Although ideally you should configure your network discovery policy with non-overlapping rules, the system does drop duplicate connection logs generated by managed devices. However, you CANNOT drop duplicate connection logs for connections detected by both a managed device and a NetFlow exporter.
There are
two types of Network Discovery: Active and Passive. The usual type of Network
Discovery being performed in FMC is Passive, where it just wait and sniff for
the Hosts and Applications that are running in the network. Active Network
Discovery is where you run the Nmap scanner feature in FMC.
It's
highly recommended perform a Network Discovery for an extensive period of time
(ideally 2 weeks to a month) in order for the FMC to get a good picture of what it will
protect and before deploying the Access Control Policy (ACP) rules.
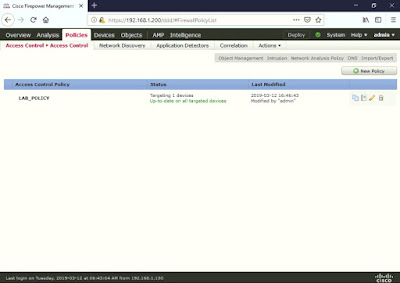
To view
the ACP, go to Policies > Access Control
> Access Control.

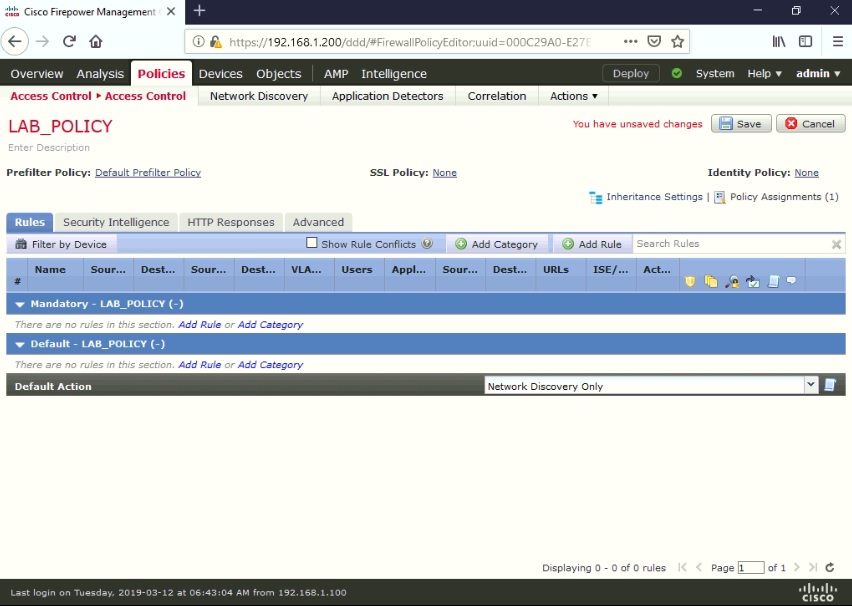
Click edit (pencil icon) on the configured ACP created earlier (LAB_POLICY).

There currently no Rules created and the Default Action (bottom) is set to Network Discovery Only. Click Logging (scroll icon).

Tick Log at End of Connection. The Event Viewer under Send Connection Events to will be automatically selected. Click OK.

Click Save > Deploy.
Tick on the target device > Deploy.

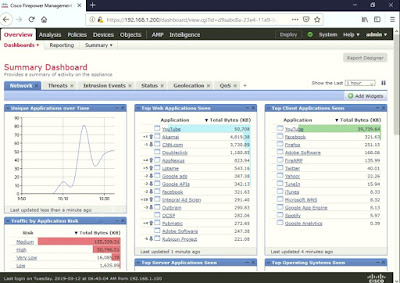
I streamed some videos in Youtube.com and CCN.com in order to generate data in the FMC Summary Dashboard. This is performing a Passive Network Discovery since we're sniffing for network traffic and send to the FirePOWER module.

To view the Networks covered by the Network Discovery policy, go to Policies > Network Discovery > Networks. Notice all networks are being matched by default.

Click edit (pencil icon) on the right. Notice all Networks are configured for Network Discovery. It's good practice to narrow down the network scope in order to minimize the collected data and send to the FMC database (avoiding public Internet addresses, Bogons, etc.).

Create an
object for the private IP subnet 192.168.0.0/16.
In my lab, I've used 192.168.1.0/24 for
the wired LAN and 192.168.10.0/24 for
wireless.
Go to Objects > Network > Add Network > Add
Object.

Type the Name > Network: 192.168.1.0/24 (in CIDR notation) > Save.

Configure the same for the wifi network.

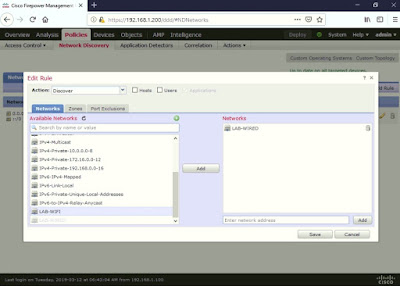
Go back and edit the default Network Discovery Policy under Policies > Network Discovery > edit (pencil icon).

Delete the all zero network (0.0.0.0/0 for IPv4 and ::/0 for IPv6) by clicking on the trash icon.

Click on the Network Object created earlier > click Add to move it to the right.

Under Action: Discovery tick Hosts > Save.

Leave the default under the Zones and Port Exclusions tabs.


Click Deploy (beside the green check mark).

Tick the target device > Deploy.

Click on Custom Operating Systems (above Out of date on 1 targeted devices) > Create Custom Fingerprint.

You can create Custom OS Fingerprint.

Click on Custom Topology.

Click Create Topology. This would provide the FMC (and admin) of the IP address scheme of your network.

You can dynamically add a network by typing a Name > click Import Policy Networks > Load.

Or add a manually by clicking Add Network.
In this case I chose to add Networks manually.
Type the Topology Information Name > Network Name,
IP Address and Netmask > click Add.


Click Save.

Click on the slide button (make it blue check) to enable.

Go back again to Network Discovery policy under Policies > Network Discovery.

Leave the default under the Users tab.

Go to Advanced > General Settings.

Tick Capture Banners > Save. This is to capture server OS Banners. Leave the other options in default.

Click Deploy.

Tick the target device > Deploy.

To view network traffic, go to Overview > Dashboards. This will automatically go to the Firepower Summary Dashboard.


The gathered data for Network Discovery is available under Analysis > Hosts.

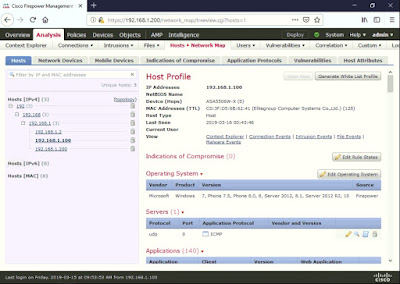
Under Network Map you'll find the discovered IP addresses based on the Network Discovery scope. Click on the plus (+) symbol to expand the scope. I turned off other VM in my lab since the FMCv eats a lot of memory.

Click on a specific IP address to view more details on the Host Profile page. The 192.168.1.2 is the Cisco ASA FirePOWER module.

The 192.168.1.100 is my Windows 10 VM host.

The 192.168.1.200 is the Cisco FMCv. Click on Connection Events under the View option.

A new page will open and displays the filtered Connect Events using 192.168.1.200 as the Initiator IP.

You can manually define the host OS by clicking on the Edit Operating System.

A drop-down option will appear for the OS Definition. The 192.168.168.1.100 is using Windows 10 64-bit OS.

Select the correct OS Definition > click Finish.


You'll find the Applications and Protocols that are running on the specific host.

The Vulnerabilities will also be listed for the host OS.

Click on the topology hyperlink (on the right of Host [IPv4]. The 192.168.1 hosts are grouped under the LAB-WIRED - 192.168.1.0/24.

Go to Analysis > Hosts > Hosts to view a summary of the host OS information that were gathered.


Go to Analysis > Hosts > Indication of Compromise to view any compromised or infected host.


Go to Anyalysis > Hosts > Applications to view the detected Applications and hit Count running in the network.


Go to Analysis > Hosts > Application Details to view more details on a particular Application and hit Count.


Go to Analysis > Hosts > Servers to view Hosts running Server Applications and hit Count.


Go to Analysis > Hosts > Host Attributes.

Go to Analysis > Hosts > Discovery Events to view Host and Application discovery events.


You can
also perform Active Network Discovery via the Nmap feature in FMC. This is
useful for critical servers and applications running in the network.
To create
and run the Nmap scan, go to Policies >
Actions > Scanners.

Click Add Nmap Instance.

Type the Instance Name > type the IP for Black Listed Scan hosts. I've typed the FMC IP 192.168.1.200 to bypass the Nmap scan. Click Create.

Under Configured Remediation > select Nmap scan (the only option available) > click Add.

Type the Remediation Name > select the Scan Which Address(es) from Event (I chose Scan Destination Address Only).

Choose the Scan Type (I chose the default TCP Connect Scan).

I left
the other options in default and under the Port
Ranges and Scan Order, I've typed T:1-1023
which is TCP well-known ports 1-1023. Click Create.

After the Nmap Scan Instance has been created, click Scan Now (green arrow button on the far right).

Type the IP Range (or host IP address) manually
> the Ports field were automatically
pre-filled to the well-known ports 1-1024 > click Scan Now.
I just
typed the IP address of my Windows 10 machine (VM host) in order to save time
running the Nmap scan.

The Nmap Scan will finish in a few minutes (depending on the Scan type and Port range defined). My Nmap Scan Instance was finished in 2 minutes.

To view the Nmap scan result, go to Analysis > Hosts > Discovery Events.

Look under Event: Add Scan Result and Description: Scanner Nmap. Click on the PC icon (Open Host View) with the scanned IP address (192.168.1.100).

The Nmap scan was able to discover more ports or services (count of 7) versus the previous count of one (1) under Servers.
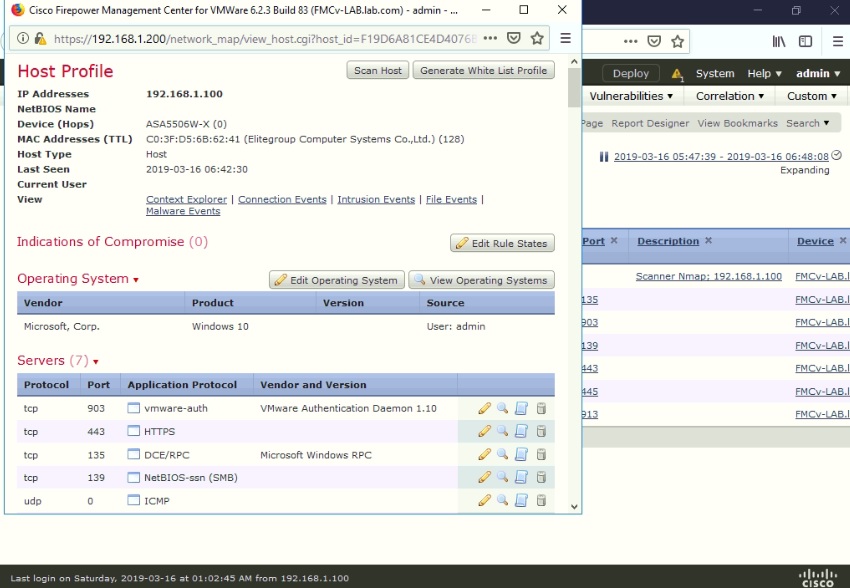
Further below is the Nmap Scan Results.

You can also perform a scheduled Nmap scan under System > Scheduling.

Click Add Task.

Under Job Type: select Nmap Scan.

Fill up the needed info and click Save.

No comments:
Post a Comment